Programming in the Life Sciences #19: debugging
Debugging is the process find removing a fault in your code (the etymology goes further back than the moth story, I learned today). Being able to debug is an essential programming skill, and being able to program flawlessly is not enough; the bug can be outside your own code. (… there is much that can be written up about module interactions, APIs, documentation, etc, that lead to malfunctioning code …)
While there are full debugging tools, achieving the task of finding where the bug is can often be reached with simpler means:
- take notice of error messages
- add debug statements in your code
Error messages
Keeping track of error messages is first starting point. This skill is almost an art: it requires having seen enough for them to understand how to interpret them. I guess error messages are the worst developed aspects of programming language, and I do not frequently see programming language tutorial that discuss error messages. The field can certainly improve here.
However, at least error messages in general give an indication where the problem occurs. Often by a line number, though this number is not always accurate. Underlying causes of that are the problem that if there is a problem in the code, it is not always clear what the problem is. For example, if there is a closing (or opening) bracket missing somewhere, how can the compiler decide what the author of the code meant? Web browsers like Firefox/Iceweasel and Chrome (Ctrl-Shift-C) have a console that displays compiler errors and warnings:
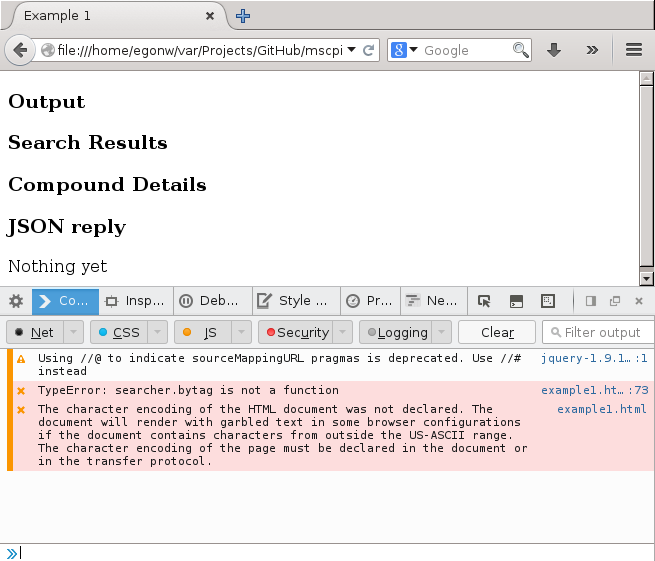
Another issue is that error messages can be cryptic and misleading. For example, the
above error message “TypeError: searcher.bytag is not a function example1.html:73”
is confusing for a starting programmer. Surely, the source code calls searcher.bytag()
which definately is a function. So, why does the compiler say it is not?? The bug here,
of course, is that the function called in the source code is not found: it should be
byTag().
But this bug at least can be detected during interpretation and executing of the code. That is, it is clear to the compiler that it doesn’t know how to handle the code. Another common problem is the situation where the code looks fine (to the compiler), but the data it handles makes the code break down. For example, an variable doesn’t have the expected value, leading to errors (e.g. null pointer-style). Therefore, understanding the variable values at a particular point in your code can be of great use.
Console output
A simple way to inspect the content of a variable is to use this console visible in
the above screenshot. Many programming languages have their custom call to send output
there. Java has the System.out.println() and JavaScript has console.log():
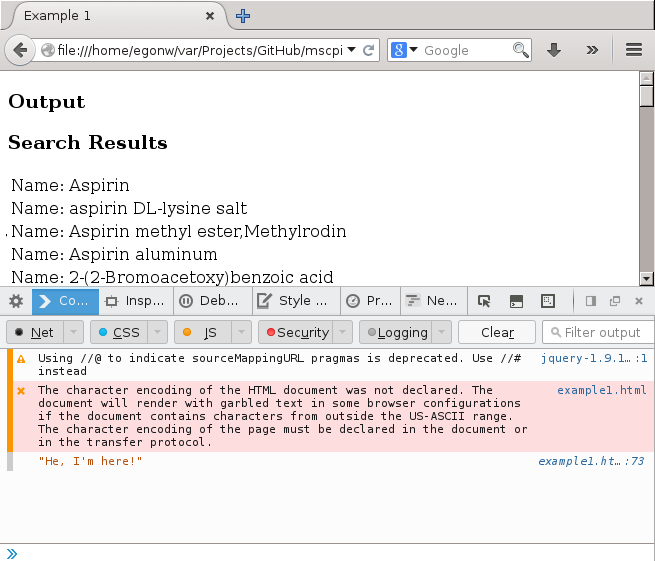
Thus, if you have some complex bit of code with multiple for-loops, if-else statements, etc, this can be used to see if some part of your code that you expect to be called really is:
console.log("He, I'm here!");
This can be very useful when using asynchronous web service calls! Similarly, see what the value of some variable is:
var label = jsonResponse.items[i].prefLabel;
console.log("label: " + label);
Also, because JavaScript is not a strongly typed programming I frequently find myself inspecting the data type of a variable:
var label = jsonResponse.items[i].prefLabel;

console.log("typeof label: " + typeof(label));
Conclusion
These tools are very useful to find the location of a bug. And this matters. Yesterday,
I was trying to use the histogram code in example6.html
to visualize a set of values with negative numbers (zeta potentials
of nanomaterials, to be precise) and I was debugging the issue, trying to find where
my code when wrong. I used the above approaches, and the array of values looked in
order, but different from the original example. But still the histogram was not
showing up. Well, after hours, and having asked someone else to look at the code
too, and having ruled out many alternatives, she pointed out that the problem was
not in the JavaScript part of the code, but in the HTML: I was mixing up how
default JavaScript and the d3.js library add SVG content to the HTML data model.
That is, I was using <div id="chart">, which works with document.getElementById("chart").innerHTML,
but needed to use <div class="chart"> with the d3.select(".chart").innerHTML
code I was using later.
OK, that bug was on my account. However, it still was not working: I did see a histogram, but it didn’t look good. Again debugging, and after again much too long, I found out that this was a bug in the d3.js code that makes it impossible to use their histogram example code for negative values. Again, once I knew where the bug was, I could Google and quickly found the solution for it on StackOverflow.
So, the workflow of debugging at a top level, looks like:
- find where the problem is
- try to solve the problem
Happy debugging!